In the bustling world of retail, understanding customer behavior is crucial for success. One powerful tool that has emerged as a game-changer is data visualization, particularly through the use of heat maps. Let’s dive into how this specific type of chart can reveal pivotal insights in the retail business and how PeakMet is revolutionizing this space with AI-driven solutions.
Flame

The Magic of Heat Maps in Retail

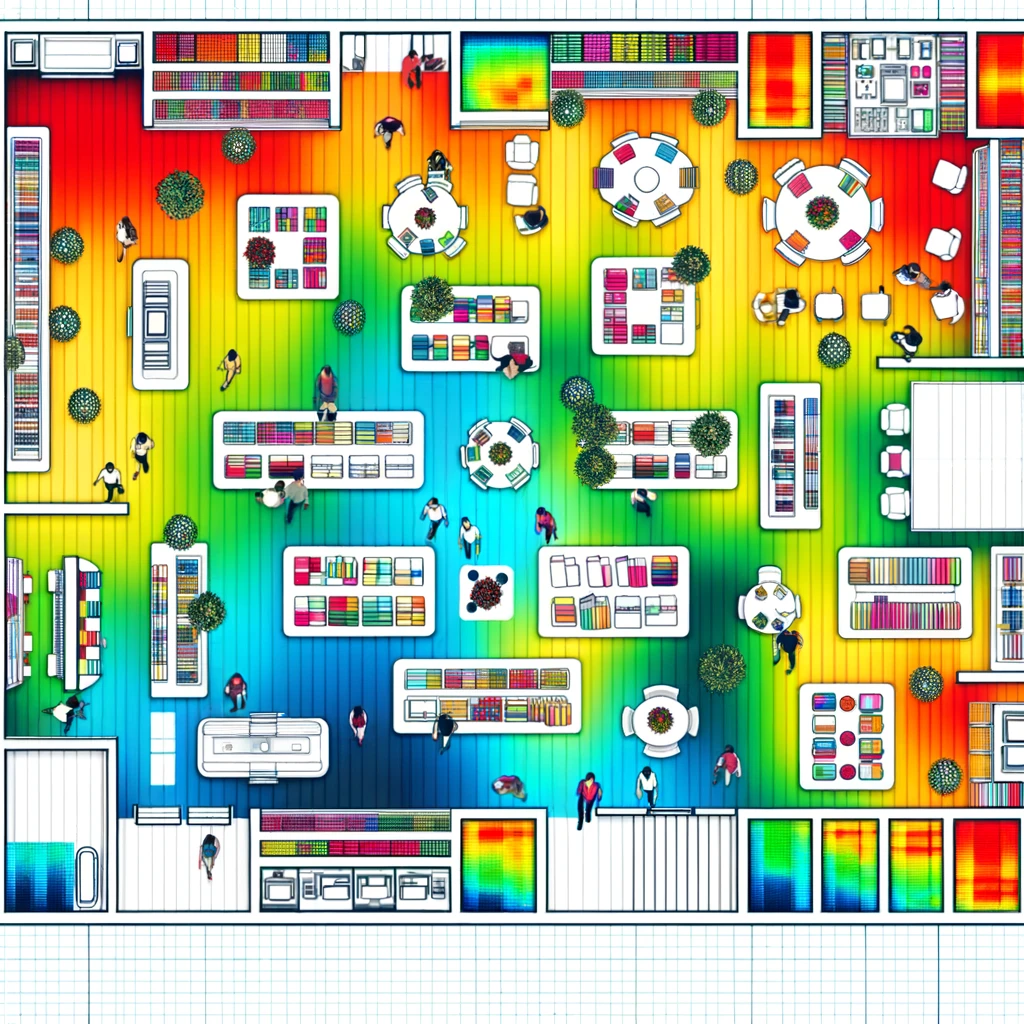
Heat maps are like the GPS of retail analytics. They use color gradients to represent data values, making complex information digestible and actionable. In a retail context, heat maps can show where customers spend most of their time in a store, which products they interact with the most, or how foot traffic varies at different times.
For example, imagine a department store using heat maps to track customer movements. They might discover that the electronics section is a hot spot in the morning but cools down in the evening, while the clothing section shows a consistent temperature throughout the day. This insight can help the store optimize product placement, staffing, and promotional strategies.
A real-world case is Walmart’s use of heat maps to optimize store layouts and improve customer experience. By analyzing foot traffic patterns, Walmart identified areas of congestion and adjusted shelf placements to create a smoother shopping experience .
PeakMet’s Role in Elevating Data Visualization

PeakMet leverages the latest AI technologies to enhance data visualization tools like heat maps. Our platform not only tracks basic metrics but also uses machine learning algorithms to predict future trends, identify anomalies, and offer actionable recommendations.
Imagine PeakMet’s heat maps not just showing current customer behavior but also predicting how changes in store layout, product placement, or promotions could shift these patterns. This predictive capability allows businesses to stay ahead of the curve and make data-informed decisions that drive growth and customer satisfaction.
How Businesses Can Benefit from PeakMet’s Data Visualization

By integrating PeakMet’s advanced data visualization tools, businesses can:
- Gain deep insights into customer behavior and preferences.
- Optimize store layouts and product placements based on real-time data.
- Predict and respond to market trends and customer needs effectively.
- Enhance decision-making processes with AI-powered analytics.
In conclusion, the use of data visualization, specifically heat maps, in the retail sector can uncover invaluable insights that drive strategic business decisions. With PeakMet’s AI-enhanced tools, businesses can transform raw data into a strategic asset, leading to improved operational efficiency, customer satisfaction, and profitability.
Citations
- Forbes, “Predictions: How Data And AI Will Shape Business Growth In 2022”, Forbes
- Business Insider, “Walmart To Offer Its Technologies To Help Other Businesses With Digital Transformation”, Business Insider


